
Good morning and happy Monday!
“If your broker or investment advisor is not familiar with the concept of standard deviation of returns, get a new one.”
– William Bernstein, neurologist & financial theorist
Well, today I’m going to let my inner nerd out a bit. Today I’m going to address a very important investment concept called standard deviation.
This is what the standard deviation formula looks like:
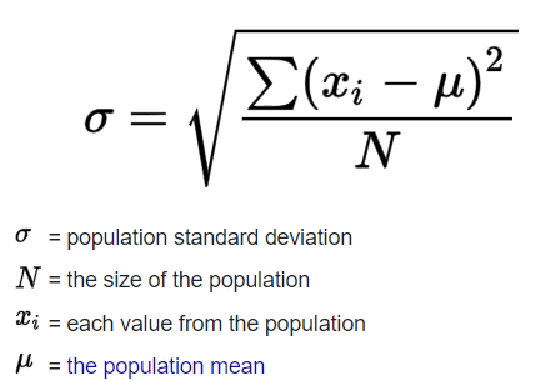
Don’t worry, there’s not going to be a test and I’m not going to ask you to do a formula. I’m much more interested in real-life scenarios.
In real-life investing here’s the bottom line: Standard deviation is a measurement of risk.
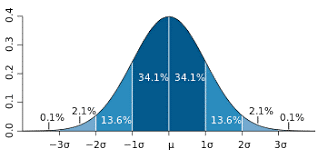
- 1 standard deviation covers 68% of the data points
- 2 standard deviation covers 95% of the data points
- 3 standard deviation covers 99.7% of the data points
This is usually represented by a bell curve that looks like this:
As is true with so many financial concepts I think an example will illustrate this concept best.
Completely hypothetical, let’s say a particular investment has an expected annual rate of return of 10% and a standard deviation of 20.
What you would do is take that 10% and minus 20 and plus 20 to get one standard deviation. For 2 standard deviation you just take that standard deviation of 20 and double it, to make it 40. 3 standard deviation is 3 x 20 = 60.
So, that means that for this particular hypothetical investment:
- 68% of the time (1 standard deviation) the return of that investment would be between -10% and +30% (20% on either side of 10%)
- 95% of the time (2 standard deviation) the return would be between -30% and + 50% (40% on either side of 10%)
- 99.7% of the time (3 standard deviation) the range would be between -50% and + 70% (60% on either side of 10%)
Personally, I like to focus on 2 standard deviation as this gives me a 95% range. In other words, statistically 19 out of 20 years will fall within 2 standard deviation. That 1 in 20 years could fall on either end … it could be super good with a return above 50%, or super lousy with a return worse than a 30% loss in this particular example.
So, for this hypothetical example (10% expected rate of return and a standard deviation of 20), I want to determine if I feel that a potential one-year loss of 30% is a worthwhile tradeoff of an 10% expected annual return.
When we are constructing your portfolio, standard deviation is a major consideration.
Rate of return is only part of the story … how much risk did you have to take to get that return? That’s what standard deviation helps us determine.
What do all of us as investors want? The highest possible return with the lowest possible risk. Standard deviation is how we measure that risk.
Let’s look at just a couple of other quick examples and I’ll wrap up.
Let’s say I’m considering 3 different investments.
- Investment #1: Expected annual return = 5%, standard deviation = 5
- Investment #2: Expected annual return = 7%, standard deviation = 11
- Investment #3: Expected annual return = 9%, standard deviation = 18
| Investment #1 | Investment #2 | Investment #3 | |
| Really bad year (2 standard deviation) | -5% (5% – 10%) | -15% (7% – 22%) | -27% (9% – 36%) |
| Bad year (1 standard deviation) | 0% (5% – 5%) | -4% (7% – 11%) | -9% (9% – 18%) |
| Expected return | +5% | +7% | +9% |
| Good year (1 standard deviation) | +10% (5% + 5%) | +18% (7% + 11%) | +27% (9% + 18%) |
| Really good year (2 standard deviation) | +15% (5% +10%) | +29% (7% + 22%) | +45% (9% + 36%) |
As you can see from these hypothetical examples, the more risk I am willing to take as an investor the greater the return potential I have. Greater risk = greater potential for return.
Some folks would look at these 3 investments and say “No way! I could not stomach even a 5% drop in my investment value.” These investors should stay away from stocks because there is too much volatility for them to handle.
Alternatively, there might be some investors who get really excited about investment #3. “Swing for the fences. Go big or go home.” These speculative investors are willing to accept a wide range of potential outcomes (95% of the time their returns will be between +45% and -27% … that’s a 72% range) in order to maximize their growth.
There is no right answer here … this is a matter of determining what each investor is comfortable with on the spectrum of risk verses return.
It’s a lot easier to take risk when things are going well, but risk taking is far more profitable when you are least likely to feel like taking risk … but that’s another topic for another time.
I know this is kind of an advanced topic for a weekly memo, but I do hope it was helpful in shedding a little light on some of the internal mechanics we evaluate when building portfolios.
If there is ever a point where you would like to learn more, I am honored to talk further about this topic (or any topic I bring up in these weekly memos).
I am so honored that you have trusted my team and I to guide you through this investing world. Please never hesitate to reach out with any questions.
Make it a great week ahead!