
Good morning, happy Monday, and happy Martin Luther King, Jr. Day!
“The ultimate measure of a man is not where he stands in moments of comfort and convenience, but where he stands at times of challenge and controversy.”
– Dr. Martin Luther King, Jr.
Investing is not easy. I know that is not breaking news to you. 😉 To illustrate this I’m going to pull out a few more charts and continue my commentary from last week on 2023.
This chart below shows the annualized rates of return for the S&P 500 going back to 1980. The gray bar and the gray numbers represent where the market ended that year. The red dot and red numbers show the lowest point of the market that year.
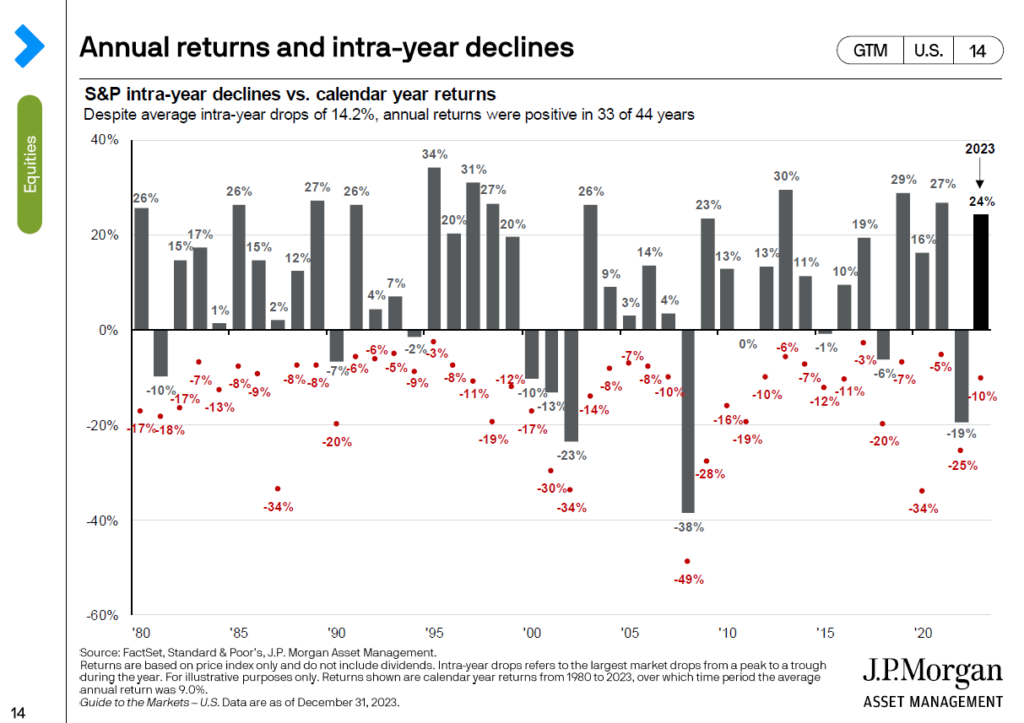
So, 33 of the last 44 years have been positive, but in every year there have been downturns. The average annual drop is 14.2%! In 2023 we saw a 10% downturn in a year that was up 24%. 2022 ended down 19% but was down as much as 25% during the year. Look at how insane 2020 was (ended up 16%, but was down as low as 34% during the year).
Pick a year, any year, a good year or a bad year, and you will find that there were low points, oftentimes dramatically low points. This is investing.
I repeat my earlier statement: investing is not easy.
Now, a chart that is not so volatile is the bond market:
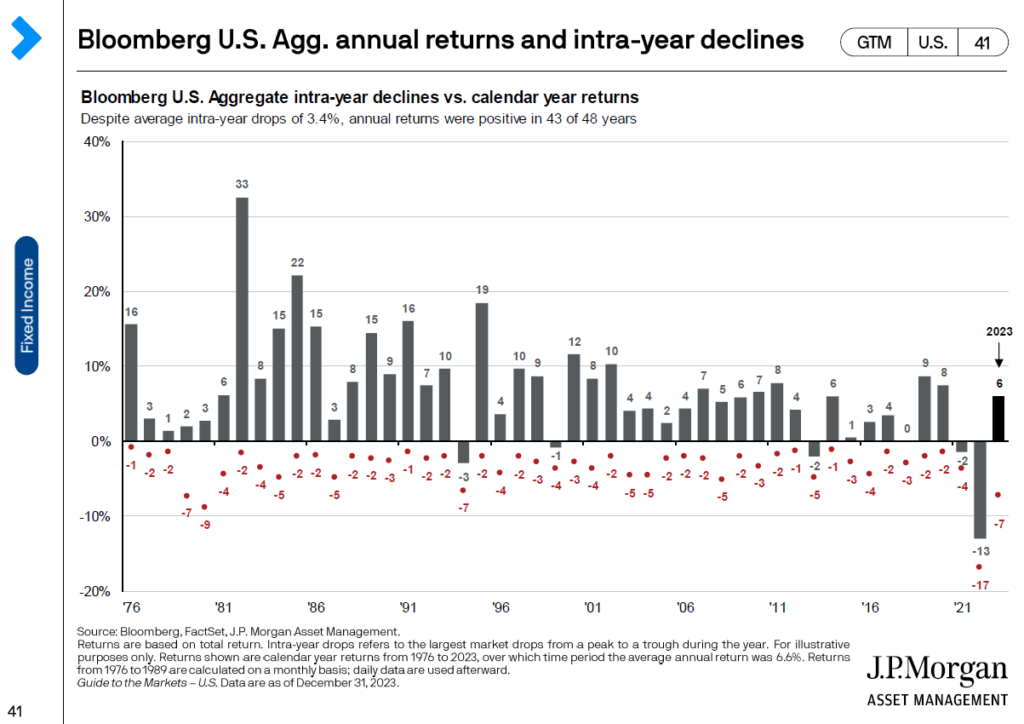
Here you see that 43 of 48 years are positive, but the average intra-year decline of 3.4% still exits. 2023 saw a gain of 6%, but was down as low as 7% during the year. 2022 was a horrible year for bonds with a 13% loss, but it was as bad as 17% during the year. Less volatile than stocks, but there is still a decent amount of fluctuation happening.
Is there any safe place to go?
Well, yes … but there is a price to pay for that. You can sit in cash (savings, money market, CDs, etc.) and have no volatility, you will never lose a penny, but that is basically a guaranteed way to lose purchasing power.
In researching this topic I came across some fascinating data from NYU (pages.stern.nyu.edu/~adamodar/New_Home_Page/datafile/histretSP.html). This research shows the returns from 1928-2022 (not yet updated for 2023) in S&P 500, U.S. government T-bills, US treasury bonds, corporate bonds, real estate and gold. Take a look at the chart (I know I might be overdoing it on the data dump today 😉) …
Historical Returns on Stocks, Bonds and Bills: 1928-2022
Data Used: Multiple data services Data: Historical Returns for the US
Date: January 2023
According to this data if you put $100 into each of these investments on 1/1/1928 here is what you would have on 12/31/2022:
- 3-month U.S. government T-bills = $2,140.51
- Real estate = $5,121.52
According to this data if you put $100 into each of these investments on 1/1/1928 here is what you would have on 12/31/2022:
- 3-month U.S. government T-bills = $2,140.51
- Real estate = $5,121.52
- U.S. treasury bond = $7,006.75
- Gold = $8,866.76
- Corporate bonds (Baa rating) = $46,379.53
- S&P 500 (including dividends) = $624,534.55
One other very important point in all of this: what cost $100 in 1928 would cost $1,852 today … this is the impact of inflation.
Now, why do I bombard you with all this stuff? Well, I’m a nerd and I love it! 😉 But besides that, I want us to be data driven investors. What does this 95 years’ worth of data lead us to?
- If you were in cash (3-month T-bills), $100 in 1928 would be worth $2,140.51 to close out 2022, roughly a 3.28% rate or return.
- If you put $100 into bonds (corporate bonds for this illustration) 95 years ago you would have a value of $46,379.53 at the end of 2022, a much more respectable 6.48% rate of return.
- If you were in the S&P 500 and reinvested your dividends, then that $100 initial investment would have a value of $624,534.55 by 12/31/2022. This is a 9.23% average rate of return.
- Don’t forget this data starts in 1928, the Great Depression started in 1929 (S&P 500 return was -8.30% in 1929, -25.12% in 1930, -43.84% in 1931 & -8.64% in 1932). The $100 got down to $50.66 by the end of 1932!
- When we factor in a 24% gain for the S&P 500 in 2023 then we are looking at a value of $774,422.84! $100 to $774,422 in 96 years!
It can get really easy to get lost in all this data. Here’s the bottom line: Inflation is constantly eroding the value of our purchasing power ($100 value in 1928 is $1,852 today), cash just barley kept up with inflation (and would have likely lost purchasing power after you factor in taxes), historically bonds have better kept up with inflation, but stocks is where real wealth has been created! Cash has virtually no fluctuation, bonds have some but are more mild than stocks, and stocks can be quite the roller coaster ride of volatility.
The price to creating real, meaningful wealth is to ride out the volatility of the stock market. This is true in times of peace and in times of war. This is true when things are going great and when things are going horrible! This is true when Democrats are in control and when Republicans are in control (more on that another time).
The question is: can you as an investor keep your focus on your goals and not derail your plan when things are tough?
The answer to this question will directly be tied to how much wealth you are able to generate in your lifetime.
I am so thrilled that my client base has repeatedly demonstrated their willingness to stay the course. I’m so proud of you! And I wholeheartedly believe you will be rewarded for that!
Stay the course, tune out the noise, keep the focus!
Thank you for the tremendous privilege of allowing us to help you navigate these investing waters.
Make it a great week ahead!