
Good morning & happy Monday!
“Headlines, in a way, are what mislead you because bad news is a headline, and gradual improvement is not.”
– Bill Gates
The last few weeks I’ve been super nerdy and really dove into the numbers. I’m going to try to control myself a little more this week, but still dive into a few more numbers. Please forgive me, I love this stuff! 😊
Please allow me to start by asking you 2 questions:
- Over the last 98 years (1926 – 2023) what percentage of those years do you think the stock market was positive more than 20%?
Less than 10% 10%-15% 15%-20% 20%-25% 25%-30% 30%-35% 35%-40% 40% or more
- Over the last 98 years (1926 – 2023) what percentage of those years do you think the stock market was negative more than 20%?
Less than 10% 10%-15% 15%-20% 20%-25% 25%-30% 30%-35% 35%-40% 40% or more
The answers may surprise you (in bold below):
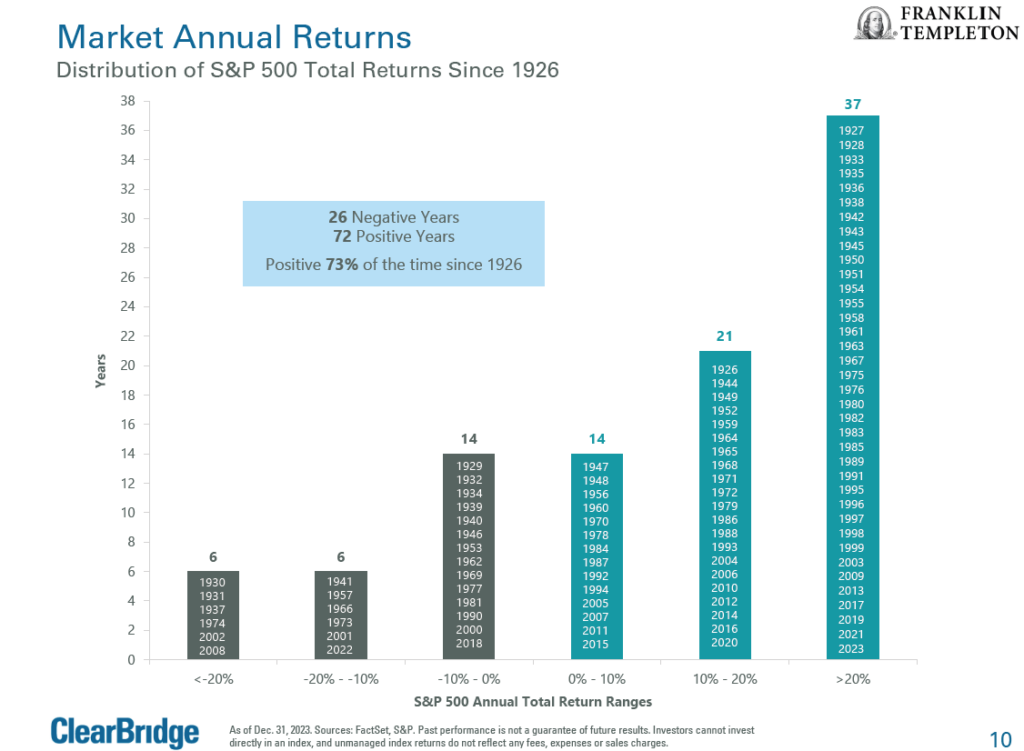
- 37 of the last 98 years (37.8%) the S&P 500 was positive more than 20%
- 21 of the last 98 years (21.4%) the S&P 500 was positive 10% – 20%
- 14 of the last 98 years (14.3%) the S&P 500 was positive 0% – 10%
- 14 of the last 98 years (14.3%) the S&P 500 was negative 0% – 10%
- 6 of the last 98 years (6.1%) the S&P 500 was negative 10% – 20%
- 6 of the last 98 years (6.1%) the S&P 500 was negative more than 20%
It’s always so fascinating to me that we have a stock market that historically is positive nearly 3 out of 4 years and yet so many people hate it. “I don’t trust the stock market” is a phrase I have heard my entire career.
If you went to Vegas and found a slot machine that you won 3 out of 4 times there would be a line out the door to play that slot machine … but the stock market for some reason causes people to run for the door.
In my statistics class in college, we studied and analyzed the fact that you are literally more likely to get struck by lightning than to win the lottery (the odds of winning the lottery are around 1 in 300 million) … and yet Florida is the top state for lottery sales, north of $9 billion per year.
Last week I addressed how investing is hard. It’s so hard that many people basically fail at it.
One more chart:
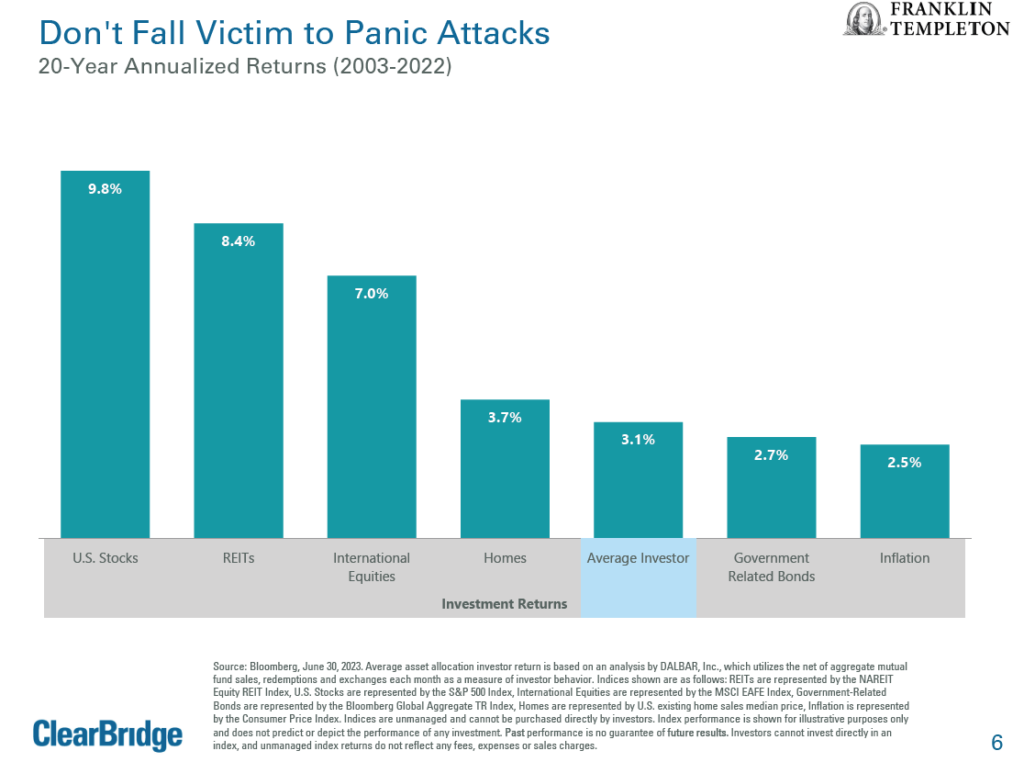
From 2003 – 2022 the U.S. stock market averaged 9.8%. Real estate (REITs) made 8.4% during that same time period. International stocks averaged 7%, U.S. government bonds returned 2.7%, and inflation averaged 2.5%. What did the average investor earn during the same period of time? 3.1%!
For illustrative purposes only, let’s assume an investor has 50% of their portfolio in U.S. stocks, 25% in international stocks, and 25% in U.S. government bonds. The average over the last 20 years (2003-2022, does not include the solid year of 2023) would have been 7.33%
So, here we have the case where the average investor underperforms the very investments they hold by over half! (Average investor = 3.1%, portfolio outlined above 7.33%)
Do you see why I sound like a broken record when I say stay the course, keep the faith, maintain the focus!
My friends, the good news is we are not average investors! We understand that patience pays off, we don’t make emotionally charged decisions, we keep a long-term viewpoint, we stay focused on our goals and tune out short-term headlines that are relentless in trying to divert us from a successful investing strategy!
Thank you for allowing us to partner with you to work towards accomplishing your cherished goals. It is beyond an honor!
Please do not hesitate to reach out if there is any way we can support you.
Make it a great week ahead!